Weather for sUAS Operations
- How to read and decode METAR weather reports
- Terminal Aerodrome Forecasts (TAFs) and how to use them
- Density altitude and how it affects drone performance
- Wind, gusts, and turbulence considerations for drone ops
- Thunderstorms, microbursts, and convective weather hazards
- Fog, low visibility, and precipitation effects on drones
- Weather resources for flight planning
Lesson 1 — Why Weather Matters More for Drones
Weather affects drone operations more acutely than manned aircraft in many respects. A Cessna 172 weighing 2,400 pounds barely notices a 15-knot gust that sends a 1.5-pound drone tumbling. The low mass and limited motor power of most commercial drones makes them highly susceptible to wind, turbulence, and precipitation. Understanding weather — not just checking whether it's raining — is a core competency for Part 107 operators.
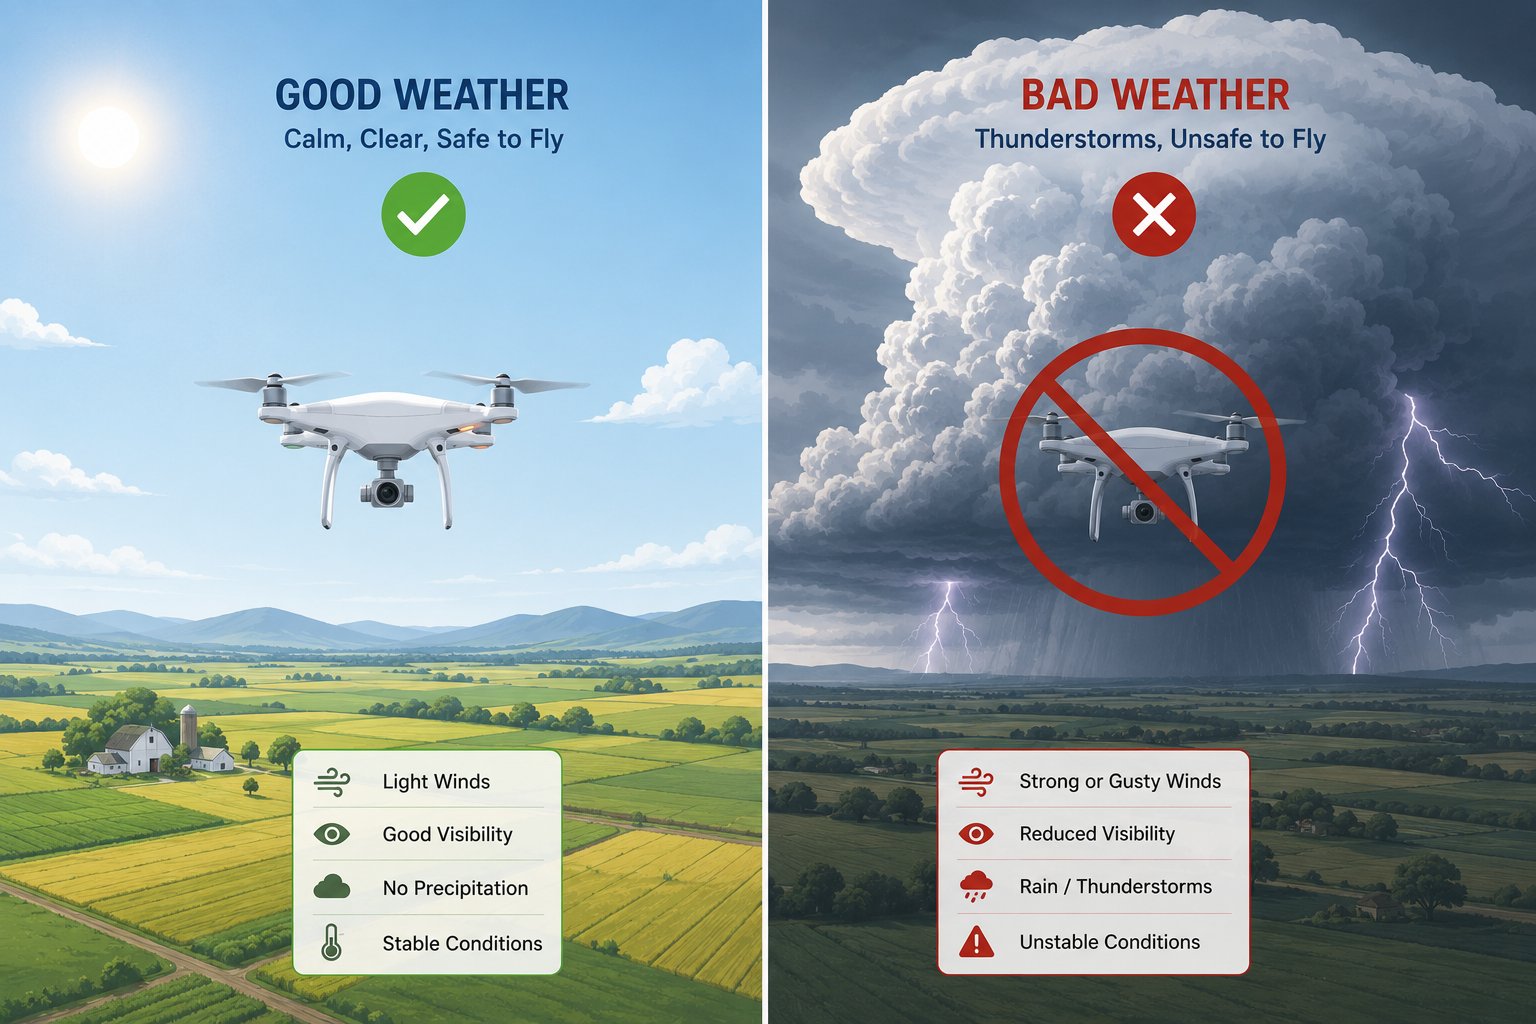
Good weather vs bad weather for drone ops — know the conditions before you fly
Beyond operational safety, weather knowledge is heavily tested on the Part 107 exam. You'll need to decode METAR reports, interpret TAF forecasts, understand density altitude calculations, and identify weather phenomena that create hazardous flight conditions. The exam uses real METAR and TAF examples — you can't pass by memorizing general concepts alone.
Weather Resources Specific to Drone Operations
Aviation weather resources are designed for manned aircraft but are equally applicable — and equally important — for drone operations. The Aviation Weather Center (aviationweather.gov) is the primary online resource for aviation weather data including METARs, TAFs, winds aloft forecasts, AIRMETs, SIGMETs, and graphical weather products. This free resource is what professional pilots use for weather briefings and is the source for most Part 107 exam weather questions.
Weather apps like Windy.com provide excellent visual representations of wind at various altitudes. For drone pilots concerned about surface to 400-foot wind conditions, the surface and 50m (164 feet) wind layers in Windy.com are particularly useful. Unlike aviation weather apps that present data in METAR format requiring decoding, Windy.com shows animated wind patterns on a map that make spatial weather interpretation intuitive. Use both — the METAR data for official weather values, and visual apps for spatial situational awareness.
Lesson 2 — Reading METARs
A METAR (Meteorological Aerodrome Report) is an hourly weather observation from an airport's automated or human weather observer. It's the most important real-time weather data source for aviation and the one most heavily tested on Part 107. Here's a complete example decoded:
METAR KORD 221552Z 27015G25KT 10SM FEW050 SCT120 BKN250 22/14 A2992 RMK AO2
| Element | Value | Meaning |
|---|---|---|
| Type | METAR | Routine hourly observation |
| Station | KORD | Chicago O'Hare (ICAO identifier) |
| Date/Time | 221552Z | 22nd day, 1552 UTC (Zulu time) |
| Wind | 27015G25KT | From 270° at 15 knots, gusting 25 knots |
| Visibility | 10SM | 10 statute miles |
| Clouds | FEW050 SCT120 BKN250 | Few at 5,000ft, Scattered at 12,000ft, Broken at 25,000ft |
| Temp/Dew | 22/14 | 22°C temperature, 14°C dewpoint |
| Altimeter | A2992 | 29.92 inHg |
| Remarks | AO2 | Automated station with precipitation sensor |
Cloud coverage terms: FEW = 1-2 oktas (eighths of sky covered), SCT (Scattered) = 3-4 oktas, BKN (Broken) = 5-7 oktas, OVC (Overcast) = 8 oktas. BKN and OVC are considered "ceiling" layers — the altitude reported affects drone pilots who must maintain 500 feet below clouds. A ceiling of BKN050 means clouds at 5,000 feet, requiring flight below 4,500 feet to maintain clearance.
Special observations: A SPECI is an unscheduled special observation issued when conditions change significantly. Watch for SPECI reports when weather is changing rapidly. METAR observations marked "AUTO" are fully automated; those marked "COR" are corrections to a previous observation.
Decoding Visibility and Present Weather
Visibility in a METAR is reported in statute miles (SM) in the US. Common visibility values: 10SM (maximum reported — actual may be better), 6SM, 3SM (Part 107 minimum), 1SM, 1/2SM, 1/4SM. Fractions indicate very low visibility. When visibility is below 3SM, Part 107 flight is not permitted.
Present weather codes appear between visibility and cloud coverage. Key codes: BR (mist, visibility ≥5/8 SM), FG (fog, visibility <5/8 SM), RA (rain), SN (snow), TS (thunderstorm), TSRA (thunderstorm with rain), DZ (drizzle), SH (showers). Intensity modifiers: minus (-) indicates light, plus (+) indicates heavy, no modifier is moderate. Heavy thunderstorm with rain: +TSRA. Light rain showers: -SHRA. These codes appear on Part 107 exam questions and require memorization.
Altimeter Setting and Pressure Systems
The altimeter setting (A2992 = 29.92 inHg) reflects current sea-level pressure at the reporting station. High pressure systems (above 29.92 inHg standard) bring stable, clear weather. Low pressure systems bring clouds, precipitation, and unstable conditions. A rapidly falling altimeter setting indicates an approaching low-pressure system — expect weather deterioration. A rapidly rising setting after a storm passage indicates improving conditions. While drone pilots don't use altimeter settings operationally the way manned pilots do, understanding pressure trends helps interpret forecast products and anticipate weather changes.
Lesson 3 — Terminal Aerodrome Forecasts (TAFs)
A TAF is a weather forecast for an airport's terminal area, typically covering a 24-30 hour period. TAFs are issued every 6 hours (0000, 0600, 1200, 1800 UTC) for airports that support significant air traffic. They use the same format and codes as METARs with additional forecast-specific terminology.
Key TAF change group indicators: FM (From) indicates a complete weather change starting at a specific time. TEMPO (Temporary) indicates fluctuating conditions expected to last less than an hour at a time. BECMG (Becoming) indicates a gradual change expected to occur over a 2-hour window. PROB30 or PROB40 indicates a 30% or 40% probability of the described condition occurring.
For drone flight planning, TAFs help you understand what conditions are forecast during your planned operation window. If a TAF shows TEMPO TSRA (temporary thunderstorms with rain) during your planned flight window, plan accordingly even if current conditions are good.
Practical TAF Interpretation for Drone Flights
For drone flight planning, focus on the TAF elements most relevant to Part 107 limits: wind speed and gusts (operational risk), visibility (must remain ≥3SM), and cloud ceilings (affect VLOS in overcast conditions, though technically ceiling is only a drone operational concern for cloud clearance requirements). A TAF showing FM (From) groups that transition from good to marginal conditions defines your operational window — plan to complete and land before the FM transition time.
TAFs are issued for airports, not for your specific operating location. A TAF from an airport 20 miles away may not accurately reflect conditions at your site, particularly if terrain or bodies of water create local weather effects. Use the TAF as a baseline and supplement with local weather observations — cloud base variations, wind gusts, and visibility can differ significantly from the TAF at distances of 10-20 miles, especially in mountainous or coastal terrain.
MOS and Hourly Forecasts
Model Output Statistics (MOS) are hourly weather forecasts generated directly from numerical weather prediction models. Available through weather.gov, MOS forecasts provide hour-by-hour visibility, cloud coverage, wind, and probability of precipitation for specific stations. For time-sensitive commercial drone operations, MOS forecasts are more useful than TAFs because they show the expected progression of conditions hour by hour rather than just transition groups.
The National Digital Forecast Database (NDFD) at weather.gov provides gridded forecasts down to individual map grid points, allowing you to get forecasts for locations not near any airport. NDFD data is incorporated into many weather apps and provides the underlying data for consumer weather forecasts. For mission-critical operations where weather windows are narrow, comparing multiple forecast sources — TAF, MOS, NDFD — gives a more complete picture than any single source.
Lesson 4 — Density Altitude
Density altitude is pressure altitude corrected for non-standard temperature. It represents the altitude at which the aircraft "thinks" it's flying in terms of air density. High density altitude means thin air — reduced lift, reduced thrust, reduced performance. For drones, high density altitude means longer motor run times to generate the same lift, reduced payload capacity, reduced speed, and shorter flight times.
Density altitude increases with: higher elevation (thinner air above sea level), higher temperature (warm air is less dense), and higher humidity (water vapor is less dense than dry air). The combination of high altitude + high temperature + high humidity creates extremely high density altitude conditions. Flying in Denver (5,280 feet MSL) on a 95°F summer afternoon may produce density altitude of 8,000+ feet.
On the Part 107 exam, you may be given a density altitude chart and asked to calculate density altitude from pressure altitude and temperature. To calculate: find your pressure altitude on the chart (field elevation +/- altimeter correction), then find the intersection with the temperature line, and read the density altitude. At standard temperature (15°C at sea level, decreasing 2°C per 1,000 feet), pressure altitude equals density altitude. Warmer than standard = higher density altitude than pressure altitude.
Pressure Altitude Calculation
Pressure altitude is calculated from field elevation and current altimeter setting: PA = Field Elevation + [(29.92 - Current Altimeter Setting) × 1,000]. Example: field elevation 500 feet MSL, altimeter setting 30.42 inHg. PA = 500 + [(29.92 - 30.42) × 1,000] = 500 + (-500) = 0 feet. When altimeter setting is above standard (29.92), pressure altitude is lower than field elevation. When below standard (low pressure system), pressure altitude is higher than field elevation.
For density altitude calculations on the exam, you'll typically be given both pressure altitude and temperature directly, or you'll calculate pressure altitude from the METAR altimeter setting and field elevation, then use a density altitude chart. Practice both calculations: the arithmetic for pressure altitude, and the chart-reading skill for density altitude from pressure altitude and temperature.
Real-World Density Altitude Planning
Apps like Sporty's E6B or ForeFlight calculate density altitude from entered values — useful for quick checks before commercial flights. The Density Altitude Calculator at suncalc.org (search "density altitude calculator") allows you to input temperature, dewpoint, and elevation to get density altitude and performance correction factors. Building density altitude awareness into your pre-flight routine takes less than a minute and prevents the unpleasant surprise of a drone that struggles to maintain altitude or climb in unexpectedly high DA conditions.
As a practical rule of thumb: for every 1,000 feet of density altitude above sea level, expect approximately 3-5% reduction in drone performance metrics (flight time, climb rate, payload capacity). At 6,000 feet density altitude — common on a hot day at Denver or Salt Lake City elevations — expect 18-30% performance reduction compared to sea-level ratings. Plan your missions and battery reserves accordingly.
Lesson 5 — Wind and Turbulence
Wind is the most common weather factor affecting drone operations. Most commercial drones have maximum wind resistance ratings — commonly 20-30 mph for consumer drones, higher for professional platforms. The FAA doesn't set a specific wind limit for Part 107 operations, but flying in winds exceeding your drone's rated capability is careless operation under 107.23.
Wind gradient: Wind speed increases with altitude. Surface friction slows wind near the ground. At 400 feet AGL — the Part 107 maximum — wind can be significantly stronger than at ground level. Your drone's flight app may show ground-level wind; the actual wind at altitude may be higher.
Mechanical turbulence is caused by wind flowing over and around obstacles — buildings, trees, ridgelines. The turbulent wake behind an obstacle can extend several times the obstacle's height downwind. Flying in the lee (downwind side) of large structures in strong winds creates unpredictable turbulence that can overwhelm a drone's stabilization systems. Maintain clearance from large obstacles when wind is significant.
Thermal turbulence develops when the sun heats the ground unevenly, creating rising columns of warm air. Thermal activity is strongest from late morning through mid-afternoon on sunny days. Dark surfaces (parking lots, rooftops) heat faster than surrounding ground, creating localized updrafts and downdrafts. Wind-driven turbulence and thermal turbulence together create the roughest conditions — afternoon flying in windy weather is the highest risk combination.
Wind Shear and Its Effects
Wind shear is a sudden change in wind speed or direction over a short distance. It can be horizontal (wind changes as you move across the ground) or vertical (wind changes with altitude). Vertical wind shear is most relevant for drone pilots — the wind at 50 feet AGL may be calm while the wind at 200 feet is 20 knots. Flying through a wind shear layer can cause sudden, unexpected attitude changes that surprise pilots and may exceed the drone's stabilization capability in severe cases.
Wind shear near weather fronts is particularly dangerous. A cold front passage can produce rapid, dramatic wind speed and direction changes. If you're flying during or near a frontal passage, expect highly variable wind conditions. The "calm before the storm" — brief calm just before frontal passage — can rapidly change to strong gusty winds as the front arrives. Monitor wind direction and speed throughout flight, not just at the pre-flight check.
Lee Turbulence and Rotor Zones
In mountainous terrain, wind flowing over ridgelines can create standing waves and rotor zones — areas of severe turbulence on the downwind side of peaks and ridges. Mountain wave turbulence can extend far downwind and can be severe enough to overwhelm any aircraft. For drone pilots operating in mountainous terrain, the most dangerous wind conditions are often not at the surface but in the rotor zones that develop between wave crests — typically 1,000-3,000 feet AGL. While most drone flights stay well below these altitudes, operations near the base of mountain ranges and downwind of ridgelines can enter rotor zones.
In urban environments, wind channeling between tall buildings creates local wind acceleration — the Venturi effect. A drone flying along a street-level corridor between tall buildings can encounter significantly stronger winds than in open areas, along with complex rotational turbulence from building wakes. Urban drone operations require specific awareness of building-induced wind effects that don't appear on standard wind forecasts.
Lesson 6 — Thunderstorms and Convective Hazards
Thunderstorms are the most dangerous weather phenomenon for any aircraft. For drones, the risk is magnified because the Part 107 400-foot ceiling keeps drones in the turbulent low-level air where surface features create worst-case conditions during storm passage. Never fly near thunderstorms.
Microburst: A localized, intense downdraft produced by a thunderstorm. Microbursts can produce vertical winds exceeding 6,000 feet per minute and horizontal winds over 100 mph at the surface. They strike without warning, are short-lived (typically 5-15 minutes), and can push a drone straight into the ground regardless of pilot input. Avoid flight within 20 miles of thunderstorm activity.
Squall lines: Lines of thunderstorms that can extend hundreds of miles and move rapidly. Conditions can change from flyable to dangerous in minutes ahead of a squall line. Check for squall line activity on radar before and during operations when thunderstorms are in the regional forecast.
The most reliable rule: if you can hear thunder, you're within lightning range. On the ground, lightning can strike 10+ miles from the storm cloud. For drones, the combination of lightning risk, extreme turbulence, and rapidly deteriorating visibility makes any proximity to thunderstorms unacceptable.
Convective Outlooks and Their Use
The Storm Prediction Center (spc.noaa.gov) issues daily convective outlooks that forecast thunderstorm probability for regions of the US. The categorical outlook scale — Marginal, Slight, Enhanced, Moderate, High — indicates the risk level for severe weather. For drone operators planning missions days in advance, the convective outlook provides useful context: a "High" risk day in your operating area means thunderstorm development is highly likely and outdoor operations should be planned with extreme flexibility.
AIRMETs (Airmen's Meteorological Information) and SIGMETs (Significant Meteorological Information) are aviation weather advisories relevant to drone operations. SIGMET CONVECTIVE (Sierra) covers severe or extreme turbulence, severe icing, and dust/sandstorms. AIRMET SIERRA covers mountain obscuration and IFR conditions. AIRMET TANGO covers low-level wind shear and moderate turbulence. These advisories, while designed for manned aircraft, identify exactly the conditions that make drone operations dangerous.
Convective Weather Decision-Making
A practical decision-making framework for convective weather: if a radar return is within 20 miles, do not launch. If conditions during flight show cumulonimbus development overhead or rapid cumulus growth in your direction, land immediately — don't finish the mission. If thunder is audible, you're already too close. The common thread: err heavily on the side of caution with convective weather. No commercial mission is worth the risk of being in the air near a thunderstorm.
Understand that radar does not show all hazards — radar detects precipitation, not turbulence. A dry thunderstorm (which can occur in arid regions like the Southwest US) shows minimal radar return but produces lightning and extreme turbulence. Convective SIGMETs and pilot reports (PIREPs) of turbulence provide information that radar alone cannot.
Lesson 7 — Fog, Visibility, and Precipitation
Fog forms when air cools to the dewpoint, causing water vapor to condense into tiny droplets that reduce visibility. For drone pilots, fog is problematic for two reasons: it reduces visibility below the Part 107 3-statute-mile minimum, and it makes maintaining visual line of sight essentially impossible. Radiation fog (forms overnight on calm, clear nights) typically burns off within 2 hours of sunrise — morning flight planning should account for fog clearing time.
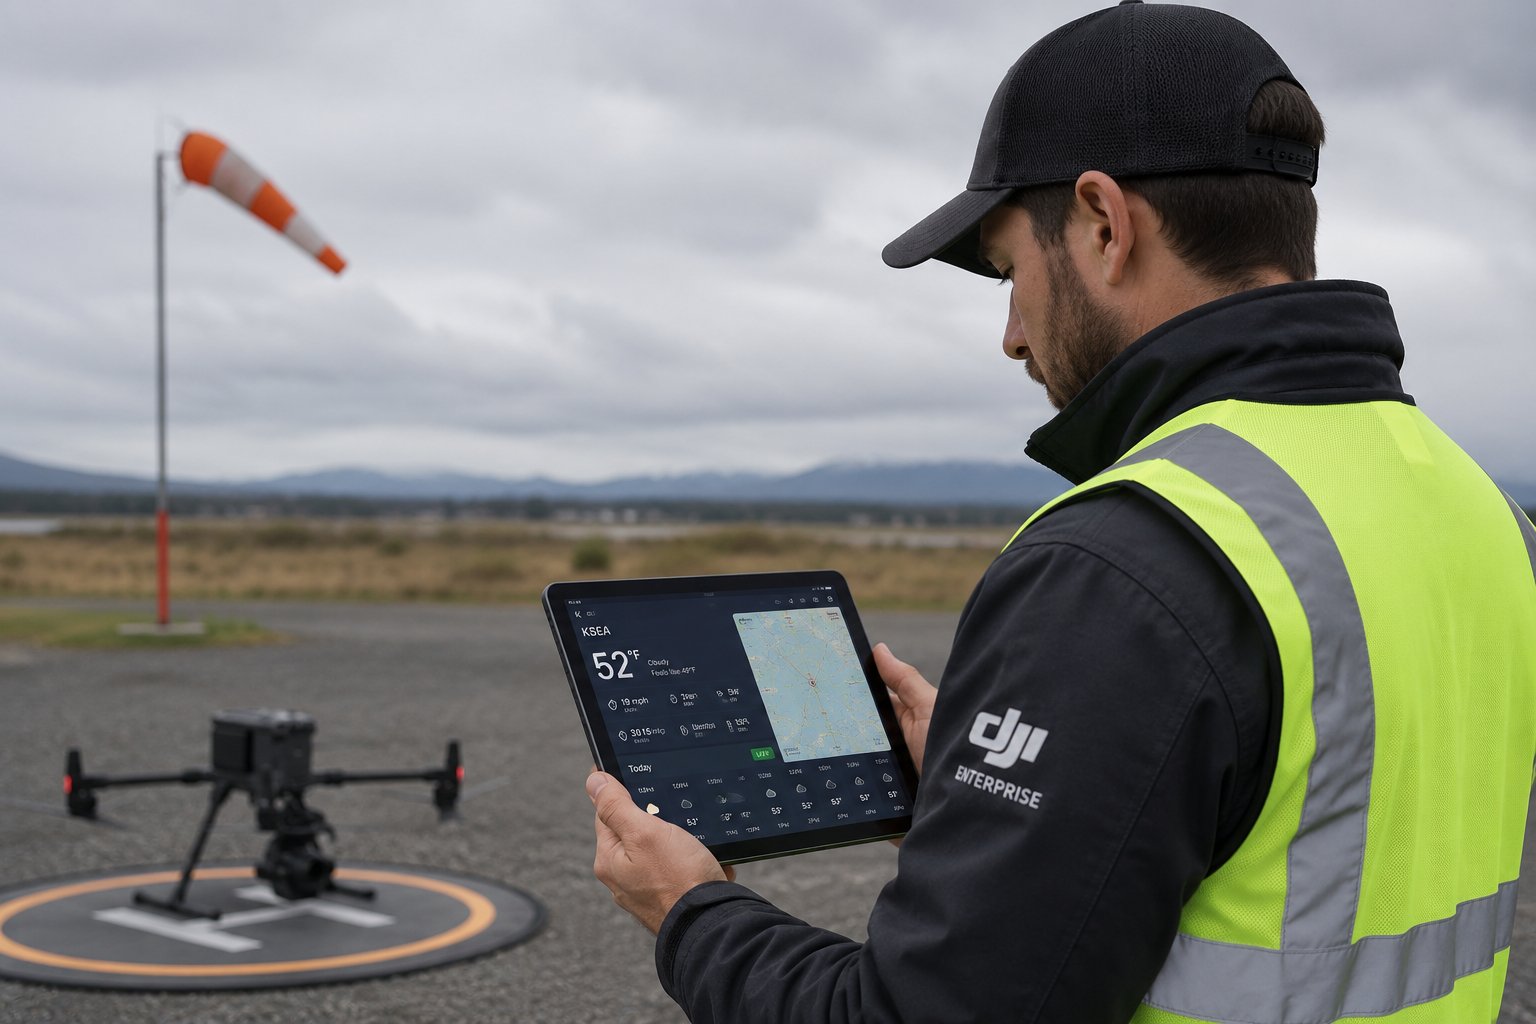
Professional drone operator checking weather data on tablet before flight — wind sock visible in background
The temperature-dewpoint spread is the most useful fog predictor. When temperature and dewpoint are within 2-3°C of each other and humidity is rising, fog is likely. As the spread narrows to zero, fog forms. METAR reports show temperature and dewpoint — if you see 15/14 (1°C spread) in an evening METAR, fog is likely overnight.
Rain and snow create multiple hazards for drones: water ingress into electronics, ice formation on propellers (even at above-freezing temperatures with supercooled water droplets), reduced visibility, and electromagnetic interference. Most consumer drones have limited or no water resistance. Check your aircraft's IP rating before flying in any precipitation. Flying through light drizzle in a non-waterproofed drone risks expensive water damage to motors, ESCs, and the flight controller.
Fog Types and Their Characteristics
Aviation recognizes several types of fog, each with different formation patterns and burn-off timing. Radiation fog forms on calm, clear nights when the ground cools rapidly by radiating heat to the clear sky. It's shallow (typically 100-300 feet deep), concentrated in valleys and low areas, and burns off within 1-3 hours of sunrise as solar heating warms the surface. Advection fog forms when warm, moist air moves over a cooler surface (classic marine layer along coastlines). Unlike radiation fog, advection fog can persist all day and is not burned off by sunrise alone — it requires wind changes to dissipate.
Upslope fog forms when moist air is forced up terrain, cooling adiabatically to the dewpoint. Common on the eastern slopes of mountains. Ice fog forms in extremely cold temperatures (below -25°F) when water vapor freezes directly into ice crystals. Each fog type has different persistence and dissipation characteristics. Knowing the type helps predict when conditions will improve — radiation fog lifts predictably after sunrise; marine layer fog may persist regardless of time of day.
Precipitation Effects on Electronics and Optics
Even light rain poses significant risks to unprotected drone electronics. Water is conductive — even small amounts on a circuit board can cause short circuits and component failure. Water on motor windings causes corrosion that accelerates bearing wear and reduces motor life. Water in ESCs creates conducting paths that can cause fires. If your drone is not specifically rated for precipitation (IP43 or higher rating), the only safe approach is to not fly in any precipitation including light drizzle.
For cameras and gimbal systems, precipitation creates lens contamination that degrades image quality and can permanently damage optical coatings. Water inside a gimbal motor can short the coils, causing expensive repairs. If rain begins during flight, terminate the mission, land in the driest available location, and inspect for water ingress before any subsequent flights. Silica gel desiccant packets stored with drones and batteries help maintain low humidity in storage cases — a worthwhile practice especially in humid climates.