Loading, Performance & Aerodynamics
- How payload weight affects drone performance and flight time
- Density altitude calculations and their effect on drones
- Basic aerodynamics of multirotor flight
- Ground effect and its operational implications
- Battery capacity planning and flight time calculations
- Center of gravity and payload positioning
- Performance degradation factors and planning margins
Lesson 1 — Weight and Its Effect on Performance
Every drone has a Maximum Takeoff Weight (MTOW) — the maximum weight at which the aircraft is certified to operate safely. Exceeding MTOW strains motors and ESCs (Electronic Speed Controllers), reduces maneuverability, decreases flight time, and can cause structural failure in crashes that would otherwise be survivable. Always know your drone's MTOW and calculate total weight — aircraft + battery + payload + any accessories — before every commercial flight.
The relationship between weight and performance is not linear. A small increase in weight creates a disproportionate reduction in flight time and an increase in motor workload. Motors running at higher percentages of their rated output generate more heat, wear faster, and are less responsive to sudden control inputs. A drone flying at 95% of MTOW has significantly reduced margins compared to one at 70% — both technically legal, but very different in real-world safety margin.
For Part 107 purposes, remember that the 55-pound weight limit applies to the entire system at takeoff — including all batteries, payload, and accessories. Operators of heavier drones (14-55 pounds) should be especially careful with payload calculations.
Understanding Manufacturer Performance Specifications
Drone manufacturers publish performance specifications — maximum flight time, maximum wind resistance, maximum service ceiling, maximum speed — that represent ideal conditions: sea level, standard temperature (15°C/59°F), no wind, new battery, no payload. Real-world performance in commercial operations rarely matches these specifications. A drone advertised for 30 minutes of flight time might deliver 22-24 minutes in normal operations, and 15-18 minutes in hot, high-altitude conditions with a payload.
When evaluating a drone for a specific commercial application, request performance data at the conditions you'll actually fly in — your typical operating altitude, temperature range, and payload configuration. Reputable manufacturers provide performance curves or tables, not just maximum-condition numbers. If a manufacturer only provides single-condition specifications, test the aircraft yourself in representative conditions before committing to commercial operations that depend on specific performance characteristics.
Payload System Weight Budgeting
For drones carrying external payloads — inspection cameras, sensors, delivery packages — weight budgeting requires accounting for every component: payload device, mounting hardware, cable management, vibration isolation system, and any additional electronics. What looks like a "1-pound camera" in the product listing may weigh 1.2 pounds with its gimbal, 1.5 pounds with the mounting plate and cable clamp. Weigh the complete payload assembly, not individual components, and include that weight in your MTOW calculation.
Weight affects more than just flight time. Heavier payloads lower the drone's center of gravity (if mounted below the airframe), affect dynamic stability, and can change the drone's handling characteristics. In gusty conditions, a drone with a heavy pendulum payload beneath it oscillates more than the same drone without payload. Test handling characteristics with any new payload configuration in calm conditions before deploying it in challenging weather.
Lesson 2 — Density Altitude and Performance Calculations
Density altitude — the altitude at which performance degrades to match actual conditions — is the most tested performance concept on Part 107. Review the calculation method from Module 4: pressure altitude + temperature correction = density altitude.
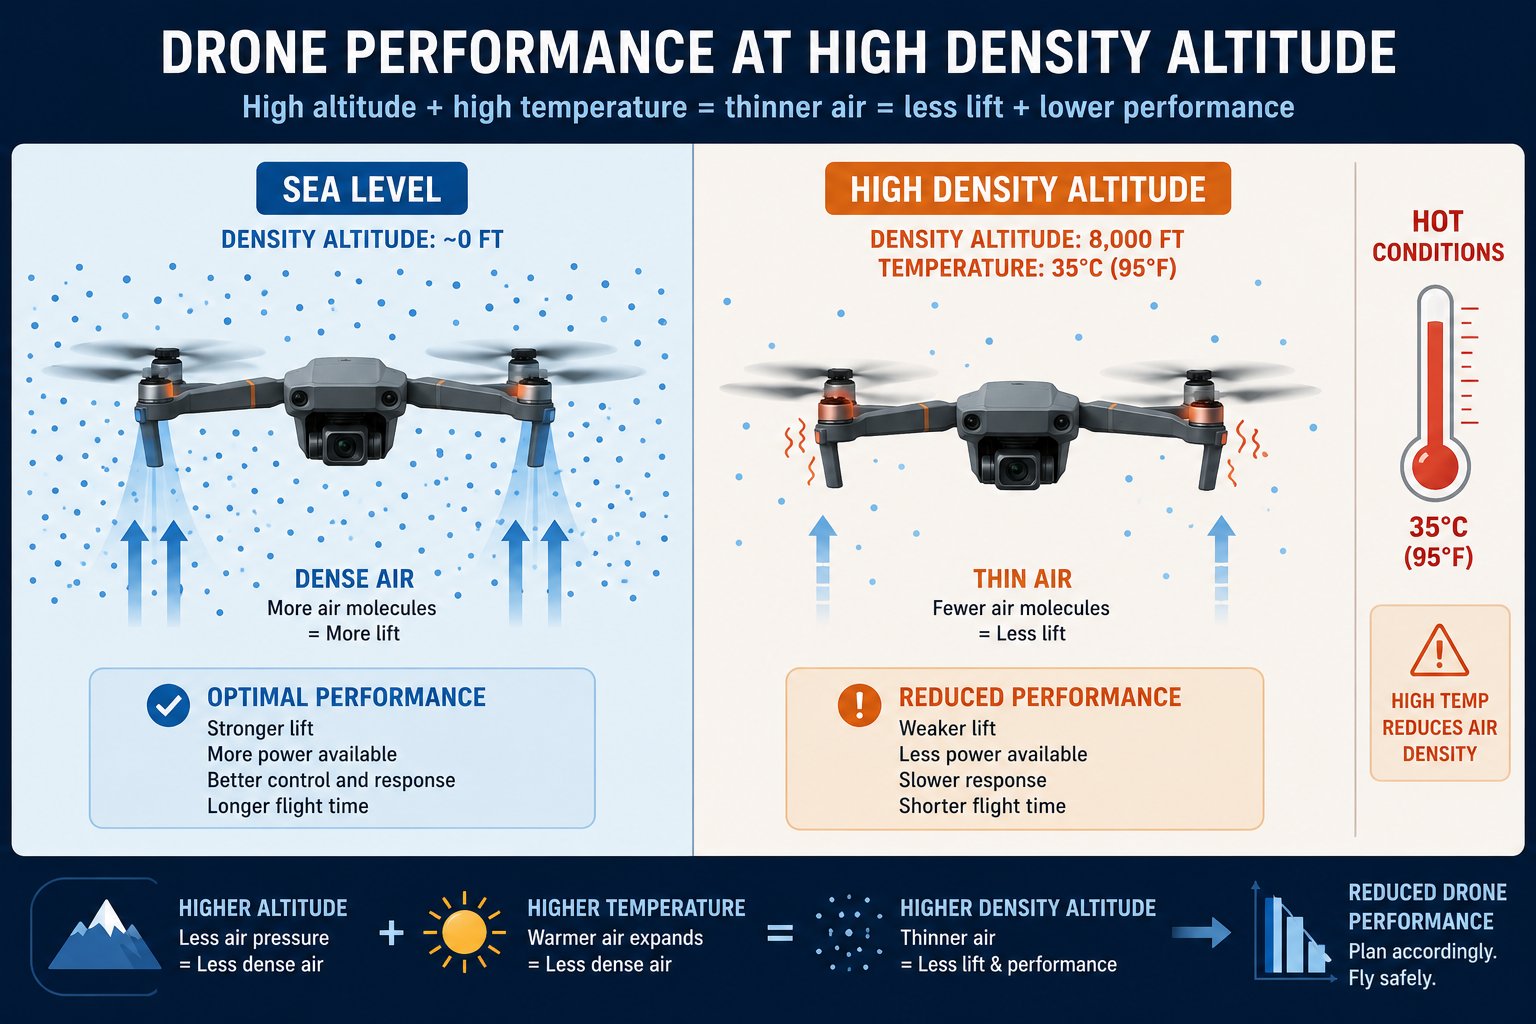
Sea level vs high density altitude — thinner air means less lift, less power, and shorter flight time
For exam questions, you'll typically be given a density altitude chart and asked to find density altitude from given pressure altitude and temperature values. Practice this skill: locate the pressure altitude on the vertical axis, find the temperature line on the chart, and read the density altitude at their intersection. A standard density altitude chart uses pressure altitude on the vertical axis, temperature lines slanting across the chart, and density altitude lines horizontal or indicated by the intersection point.
Key relationships to memorize: standard temperature decreases approximately 2°C per 1,000 feet of altitude (lapse rate). Standard sea-level temperature is 15°C (59°F). If actual temperature is warmer than standard, density altitude is higher than pressure altitude. If cooler, density altitude is lower. High density altitude = thin air = reduced performance.
Practical implications: a drone rated for a 20-minute flight at sea level on a standard day might deliver only 13-15 minutes at 5,000 feet density altitude on a hot day. Plan for this reduction. Drone manufacturers' performance specifications are typically given at standard conditions (sea level, 15°C, no wind). Real-world conditions require conservative margins.
Standard Lapse Rate and Temperature Correction
The standard atmosphere temperature lapse rate is approximately 2°C per 1,000 feet (3.5°F per 1,000 feet). This means standard temperature at 5,000 feet is 15°C - (5 × 2°C) = 5°C. At 10,000 feet, standard temperature is 15°C - (10 × 2°C) = -5°C. When the actual temperature at a given altitude is warmer than the standard value, density altitude is higher than pressure altitude. The temperature correction for density altitude is approximately +1,000 feet density altitude for each 3-4°C above standard temperature at your pressure altitude.
This relationship is what the density altitude chart encodes — it translates the temperature deviation from standard into an equivalent altitude adjustment. For exam questions without a chart: if you're at 4,000 feet pressure altitude and temperature is 10°C above standard, your density altitude is approximately 4,000 + (10/3.5 × 1,000) ≈ 6,857 feet — roughly 7,000 feet density altitude. Having this approximate calculation skill helps verify chart readings and answer questions that provide temperature without a chart.
Humidity Correction
High humidity reduces air density because water vapor (molecular weight 18) is lighter than dry air (average molecular weight approximately 29). While the density altitude chart used in Part 107 typically does not include a humidity correction, understanding that high humidity adds to effective density altitude is important for practical operations. In tropical conditions (high temperature + high humidity), density altitude can be 500-1,000 feet higher than calculated from temperature and pressure altitude alone.
The practical implication: on humid summer days in southern US states (Florida, Gulf Coast, Southeast), drone performance may be noticeably worse than density altitude calculations from temperature and pressure alone would suggest. Add a safety margin to battery planning and payload calculations when operating in high-humidity tropical conditions.
Lesson 3 — Aerodynamics of Multirotor Flight
Understanding why your drone flies — and why it sometimes doesn't behave as expected — requires basic aerodynamic knowledge. Multirotor drones generate lift through rotating propellers, each acting as a rotating wing. The propeller airfoil creates a pressure differential: higher pressure below, lower pressure above, generating an upward force (thrust).
Blade loading is the ratio of thrust to propeller disk area. Higher blade loading means each square inch of propeller disk is working harder. Smaller, faster-spinning propellers have higher blade loading than larger, slower props of equivalent thrust — and are generally less efficient. This is why larger drones with bigger propellers are more efficient than small racing drones at equivalent weights.
Translational lift occurs when a drone moves horizontally through the air at sufficient speed. The propellers encounter undisturbed air rather than recirculating their own wash, increasing efficiency. Most drones are slightly more efficient in forward flight than in a stationary hover for this reason. In calm conditions, a slow forward transit is more efficient than hovering in one place.
Vortex ring state (settling with power) is a dangerous aerodynamic condition where a drone descends into its own rotor wash. The recirculating air reduces efficiency dramatically and in severe cases creates a self-reinforcing descent that cannot be arrested by adding power alone. Avoid steep, powered descents — descend at a forward angle instead. Vortex ring state is most likely during rapid vertical descent in low wind conditions.
Gyroscopic Effects in Multirotor Systems
Individual propellers spinning at high speed are gyroscopes — they resist changes to their rotation axis (gyroscopic rigidity) and exhibit precession when forces are applied to change their orientation. In a single-rotor helicopter, gyroscopic effects of the main rotor require complex mechanical compensation. In multirotors, the counter-rotating pairs cancel most gyroscopic effects — one clockwise pair's gyroscopic forces largely cancel the counterclockwise pair's forces. This is a key design advantage of multirotors over single-rotor systems for electronic flight control.
However, residual gyroscopic effects influence multirotor behavior during rapid maneuvers. When a quadcopter pitches forward rapidly, the gyroscopic effects of the spinning rotors create slight yaw coupling — the aircraft wants to yaw slightly as it pitches. Advanced flight controller algorithms compensate for this, but aggressive pilots may notice residual coupling on basic autopilots. Understanding the source of these behavioral tendencies helps diagnose unexpected aircraft responses.
Aerodynamic Interference Between Rotors
Adjacent rotors on a multirotor aircraft interact aerodynamically — the downwash from one rotor can partially enter the inflow of an adjacent rotor, reducing efficiency. This interference increases at low altitudes (where ground effect concentrates downwash) and during specific maneuvers (particularly sideways flight, where one rotor operates in the wake of another). Motor arm length (distance between rotors) is a design tradeoff between efficiency (more spacing reduces interference) and portability (shorter arms fold smaller for transport).
Asymmetric aerodynamic interference occurs during aggressive maneuvers: as a quadcopter banks hard, the lower rotors may operate partially in the wake of the upper rotors, creating asymmetric thrust that the flight controller must compensate for. This is generally transparent to pilots using modern autopilots, but explains some of the handling differences pilots notice between large-rotor-spacing hexacopters and compact folding quadcopters.
Lesson 4 — Ground Effect
Ground effect is an aerodynamic phenomenon that occurs when an aircraft flies very close to the ground — typically within one rotor diameter. The ground interrupts the downwash from the rotors, reducing induced drag and increasing lift efficiency. A drone in ground effect requires less power to hover than the same drone out of ground effect.
This has practical implications: a drone may hover comfortably at 5 feet AGL but struggle to maintain altitude at 20 feet in high density altitude conditions. If you're operating at the performance limits of your drone — heavy payload, high altitude, hot day — the drone may hover fine on initial takeoff (in ground effect) but struggle once it climbs out of ground effect. Always test hover performance out of ground effect (>1 rotor diameter above ground) before committing to a mission profile that depends on hover capability.
Ground effect also affects landing: the increased lift efficiency as the drone descends through the ground effect zone can cause it to "float" — requiring the pilot to reduce power more than expected for a smooth touchdown. This is most noticeable in calm conditions with maximum payload.
Ground Effect in Different Surface Types
The intensity of ground effect varies with surface type. Hard, flat surfaces (concrete, pavement, water) create stronger ground effect than soft, irregular surfaces (tall grass, uneven terrain). This is because the rotor downwash reflects more completely off hard flat surfaces, creating a stronger "cushion." Launching from a tall building rooftop and hovering at 5 feet above the surface produces strong ground effect; the same hover altitude over a hillside with irregular terrain produces weaker ground effect.
Water surfaces create unusual ground effect characteristics. The rotor downwash creates ripples on the water surface that can scatter in complex patterns, and the reflective water surface creates strong ground effect that can cause the drone to "bounce" unexpectedly during low passes. Filming over water at low altitude requires specific attention to altitude management to avoid unexpected altitude excursions from ground effect interactions.
Translating Out of Ground Effect
The transition from hover in ground effect to flight out of ground effect — called "translating out of ground effect" or "OGE hover" — is where performance limitations become apparent. A drone that barely lifts off at maximum weight (in ground effect) may not be able to sustain flight once it climbs above ground effect altitude. This is the operational scenario that catches operators by surprise: the drone lifts, hovers, starts climbing, and then settles back down because it lacks sufficient power margin for OGE hover.
Always verify the drone can sustain stable hover at 10-15 feet AGL before committing to the full mission profile. This quick test — climb to twice the rotor diameter altitude and hold stable hover for 30 seconds — confirms adequate power margin for OGE operations. If the drone struggles at this altitude, reduce payload, reconsider the operation, or choose a location at lower elevation with better density altitude conditions.
Lesson 5 — Battery Capacity and Flight Time Planning
Accurate flight time prediction is essential for safe commercial operations. Flying until the low battery warning activates — rather than planning a return with adequate reserve — is a leading cause of drone flyaways and losses. A professional rule of thumb is to plan a maximum of 80% capacity use, returning when battery reaches 20% remaining. In hot conditions, above 3,000 feet density altitude, or with heavy payloads, increase reserve to 25-30%.
Battery capacity decreases with age, cold temperatures, and high power demand. A battery that's 6 months old with 200+ cycles will have noticeably less capacity than a new battery. In cold weather (below 50°F), LiPo battery capacity can drop 20-30% and voltage can sag dramatically under load — with little warning before a sudden power loss. Pre-warm batteries before cold-weather flights and reduce expected flight time accordingly.
Calculate expected flight time for each battery and each drone configuration before the mission: know your full-load hover time, your cruise flight time, and your return time from maximum range. Build in margins. The goal is to land with planned reserve, not to use emergency battery management procedures on every flight.
Flight Time Calculation Method
Accurate flight time planning starts with establishing your drone's actual (not advertised) hover time in your operating conditions. Fly a dedicated battery life test: hover the drone at the planned operating altitude and temperature, timing from launch to the point where the first low battery warning appears. Do this test with a representative payload and at the operating altitude you plan to use — not at sea level with no payload. Divide this time by 0.8 to get your usable flight time (the 20% reserve is non-negotiable).
For transit operations (flying from launch to operating area and back), calculate the transit segments separately from the operating pattern time. A drone launched 0.5 miles from the operating area may spend 3-4 minutes in transit each way — 6-8 minutes of battery not available for the actual work. For mission planning, the formula is: total available battery time × 0.8 minus transit time = available work time. With this framework, you can calculate the number of batteries needed for a given mission and predict the total operational time.
Battery Management Systems and Smart Batteries
Smart battery management systems (BMS) monitor individual cell voltages, temperatures, current flow, cycle count, and accumulated energy delivered. The BMS protects the battery from overcharge, over-discharge, and temperature extremes, and provides state-of-charge estimates displayed in the drone app. The "battery health" percentage displayed in apps is derived from BMS data comparing current maximum capacity to original maximum capacity — a battery showing 85% health has 85% of its original energy storage capacity.
BMS data also tracks anomalies: cell voltage imbalances, overcurrent events, and temperature exceedances are logged and may affect the BMS's behavior in future flights (some BMS implementations reduce maximum discharge rate after a high-temperature event, protecting the battery but reducing performance). Review your battery's BMS history in the manufacturer's app periodically — anomalies in the log can indicate developing problems before they cause in-flight failures.
Lesson 6 — Center of Gravity and Payload Positioning
For most consumer drones with integrated cameras, center of gravity (CG) is fixed by the manufacturer. For professional drones with payload systems, CG becomes a critical operational parameter. An improperly balanced drone with an off-center payload will apply asymmetric thrust to maintain attitude — some motors working harder than others, reducing efficiency and flight time.
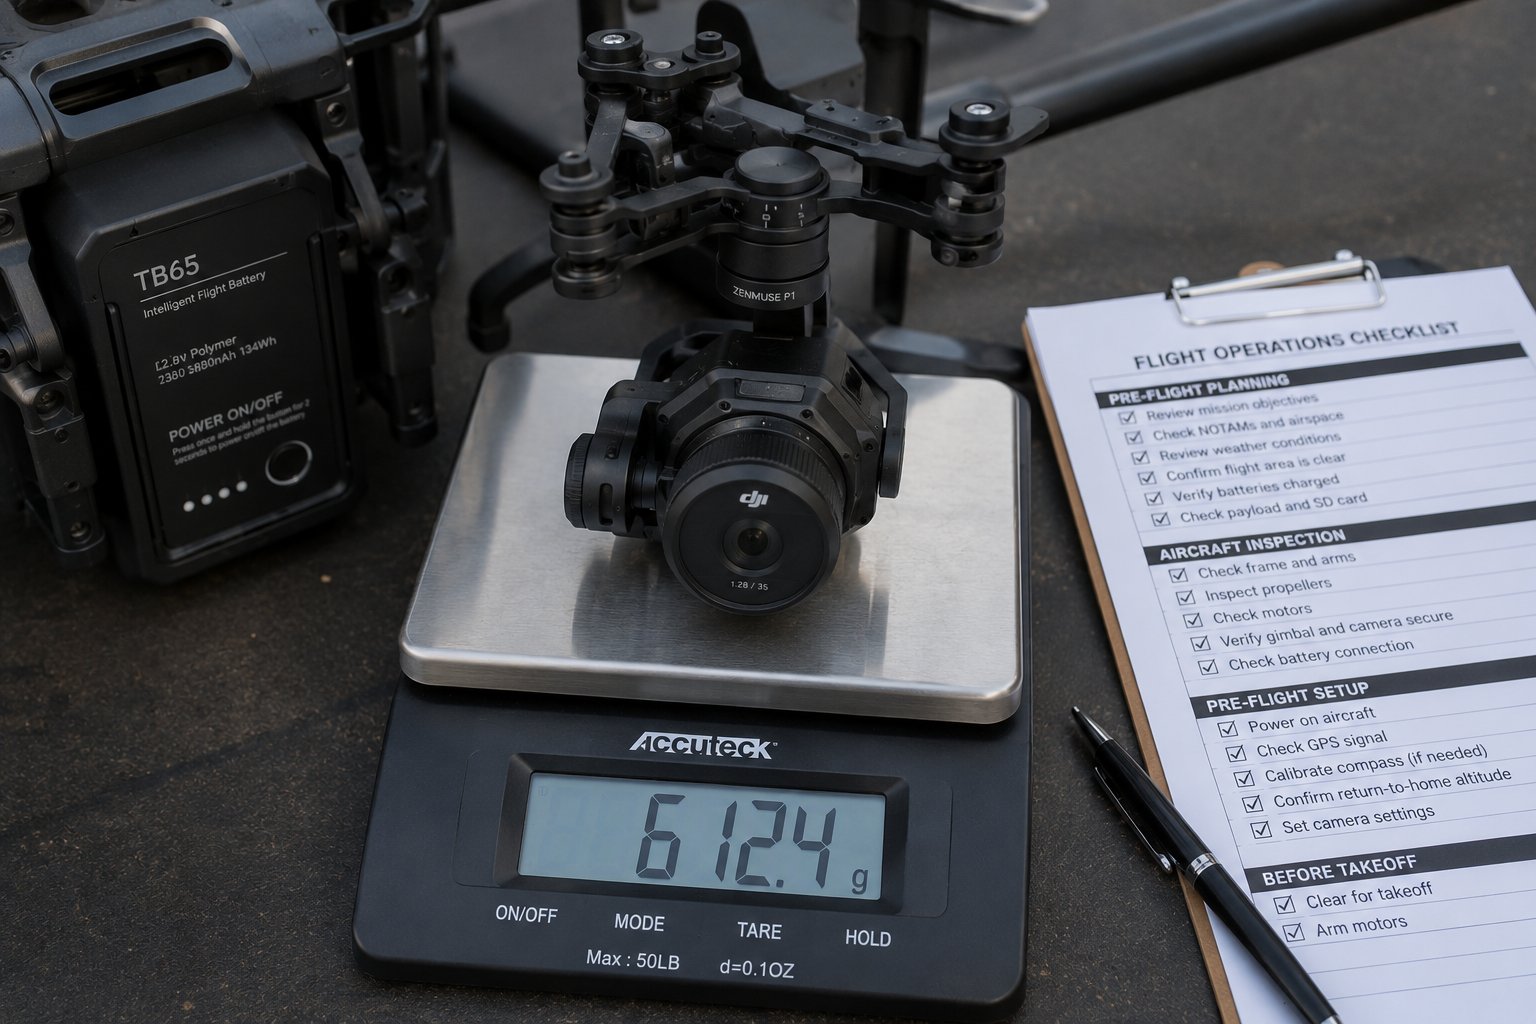
Weighing a drone payload camera and gimbal assembly — total weight must stay within MTOW
Payloads should be positioned as close as possible to the drone's CG. For payload-carrying platforms, this typically means centering the payload below the aircraft or according to the manufacturer's approved installation guidelines. Improper CG can also affect control authority — a drone with forward CG will tend to pitch nose-down and require constant rear-motor compensation to maintain level flight.
For single-axis gimbals carrying cameras, the gimbal compensates for CG-induced pitch but not roll or yaw. Lateral CG offset — payload shifted to one side — creates a persistent roll that the gimbal cannot correct, visible in footage as a constant lean. Center payloads carefully, and check hover attitude before committing to the mission flight profile.
Measuring and Adjusting CG
For professional drones with adjustable payload systems, the ideal CG position is directly below the geometric center of the rotor system — this produces symmetric motor loading and neutral handling. To verify CG: hold the drone by a single point at the expected CG location and observe whether it hangs level. If it tilts forward, CG is forward of your hold point; backward tilt means CG is aft. Adjust payload position until the drone hangs level when suspended by the CG point.
More precise CG verification uses the balancing hover test: hover the drone in calm conditions and observe whether it requires a persistent attitude correction to hold altitude. A drone with properly balanced CG hovers with all motors at approximately equal throttle. A drone with forward CG requires slightly elevated rear motor output to hold level — this shows in telemetry as asymmetric motor PWM values and can also appear as a slight nose-low attitude in hover. Correct CG imbalance before conducting performance-critical missions.
Rotating Payloads and CG Shift
Some operations require payload deployment or changes during flight — releasing a package, extending a sensor probe, rotating a multi-directional antenna. Any payload change during flight shifts the CG. Flight controllers compensate for small, gradual CG changes, but sudden large shifts (releasing a 2-pound package from one side of the drone) can cause unexpected pitch or roll excursions. If your operation involves in-flight payload changes, test the maneuver extensively at a safe altitude before deploying it operationally, and configure the flight controller's CG compensation settings if available.
Lesson 7 — Performance Margins and Conservative Planning
Professional drone operators plan with margins. Margins exist because real-world conditions are never exactly as forecast, equipment performance degrades, and unexpected situations arise. A flight plan that works only under perfect conditions is not a safe flight plan.
Key margins to build into every commercial operation: battery reserve (minimum 20%), wind reserve (plan for wind 20-30% stronger than forecast), performance reserve (expect 80% of rated performance in hot/high conditions), and time reserve (allow 20-30 minutes for setup, adjustments, and unexpected delays before an appointment or closing-time deadline). Clients and schedules create external pressure to minimize margins — maintaining them regardless is the mark of a professional operator and the difference between a successful flight and an incident report.
Building Margins Into Commercial Contracts
External pressure — the biggest threat to maintaining safety margins — originates largely from commercial commitments made without adequate weather and performance contingencies. A contract that guarantees delivery on a specific date with no weather clause creates the worst possible pressure scenario: fly or breach the contract. Professional commercial contracts for drone services should include weather hold clauses (defining the weather conditions under which operations will be rescheduled without penalty), performance limitation clauses (acknowledging that high-altitude or high-temperature conditions may affect deliverables), and force majeure provisions covering FAA-imposed airspace restrictions.
Clients who understand the operational constraints of drone services are better clients — they plan realistically, provide schedule flexibility, and don't create the pressure that leads to poor safety decisions. Part of the value a professional Part 107 operator provides is educating clients about operational constraints. A client who has been told upfront "we'll need a weather window with winds under 15 knots" makes a better partner than one who assumed you'd fly in any conditions.
Safety Management Systems for Commercial Operations
Organizations conducting regular commercial drone operations benefit from implementing a Safety Management System (SMS) — a formal framework for identifying, analyzing, and mitigating operational risks. An SMS includes: safety policy statement (commitment to safety as the priority), hazard identification process (systematic review of operations for risk), risk assessment and mitigation (procedures for addressing identified hazards), safety assurance (monitoring that mitigations are effective), and safety promotion (training, communication, culture). The FAA encourages voluntary SMS adoption for UAS operators and rewards operators who can demonstrate SMS implementation with more favorable treatment in waiver and authorization processes.